Contents
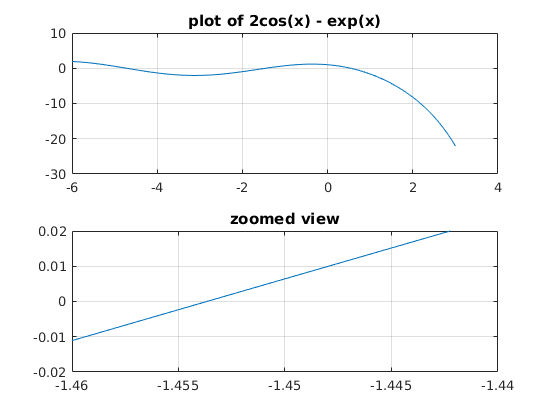
Subplot and zoom example: finding root
subplot_zoom.m
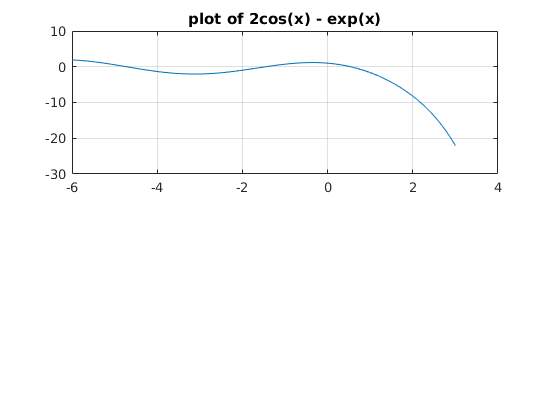
close all
subplot(2,1,1)
x = [-6:.01:3];
plot(x,2*cos(x)-exp(x))
grid on
title('plot of 2cos(x) - exp(x)')
shg
% Zoom in to see one zero in the interval [-1.46, -1.44]
Zoom in on this smaller interval about one root.
subplot(2,1,2)
xx = [-1.46:.001:-1.44];
plot(xx,2*cos(xx)-exp(xx))
grid on
axis([-1.46 -1.44 -0.02 0.02])
title('zoomed view')
shg