Plotting in 3d
Contents
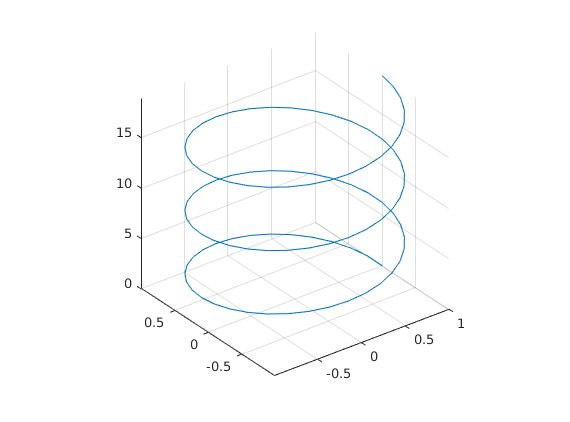
Space curve
Example:
![$$ x=\cos(t),y=\sin(t),z=t, t\in[0,6\pi]$$](plot3d_eq06186581718876905526.png)
t=linspace(0,6*pi);
x=cos(t); y=sin(t); z=t;
plot3(x,y,z)
axis equal; axis square;
grid on
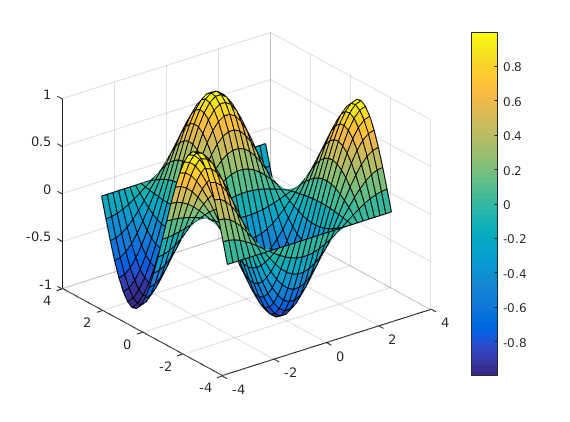
Surface plot, meshgrid
![$$f(x,y)=\cos(x) \sin(y), x,y\in [\pi,\pi]$$](plot3d_eq00571567551150047838.png)
x=linspace(-pi,pi,30);
y=x;     % No need to be the same.
% Now comes meshgrid:
[X,Y]=meshgrid(x,y);
Z=cos(X).*sin(Y);     % Remember: vector operation with (.)
% The data is ready, now "surf" it:
surf(x,y,Z),colorbar
% Several options, shading, colormap, m...
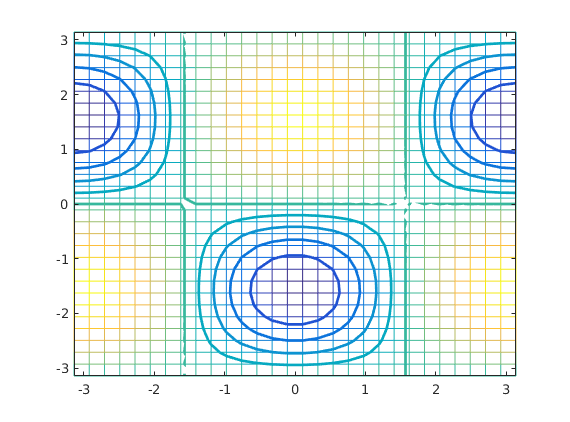
Contour plot
The same data is needed for contour plot, so we can continue:
contour(X,Y,Z,'LineWidth',2)
hold on
mesh(x,y,Z)
%
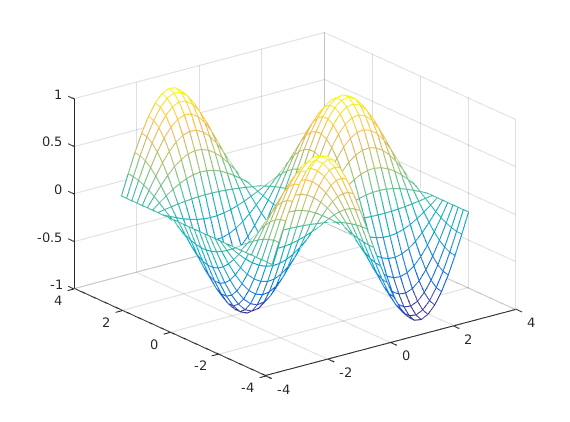
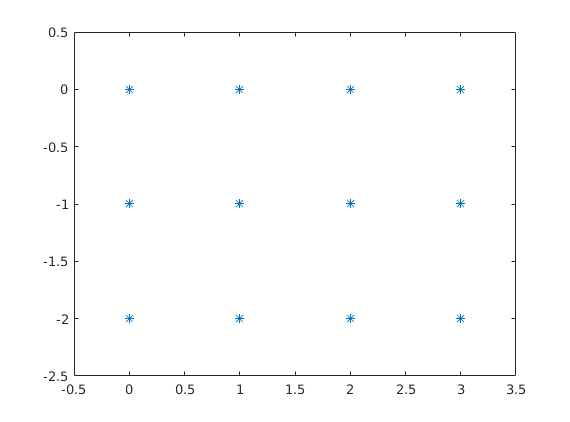
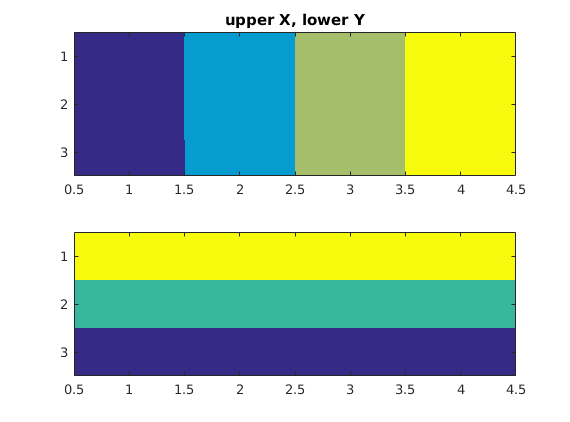
What does meshgrid do?
The Z-matrix could be obtained by
m=length(x);n=length(y);
for k=1:m
    for l=1:n
        Z(k,l)=cos(x(k))*sin(x(l));
    end
end
hold off
mesh(x,y,Z)
% Well, this is at least tedious.
Lets look at small data:
x=0:3
y=-(0:2)
[X,Y]=meshgrid(x,y)
%
% X has duplicated rows, Y has duplicated columns
% X and Y are of same size
% Look at the points:
[X(:) Y(:)]
plot(X(:),Y(:),'*');shg
axis([-.5 3.5 -2.5 .5]);shg
figure
subplot(2,1,1)
imagesc(X) %,colorbar
title('upper X, lower Y')
subplot(2,1,2)
%title('Y')
imagesc(Y)

% All is right, isn't it!
x =

     0     1     2     3


y =

     0    -1    -2


X =

     0     1     2     3
     0     1     2     3
     0     1     2     3


Y =

     0     0     0     0
    -1    -1    -1    -1
    -2    -2    -2    -2


ans =

     0     0
     0    -1
     0    -2
     1     0
     1    -1
     1    -2
     2     0
     2    -1
     2    -2
     3     0
     3    -1
     3    -2
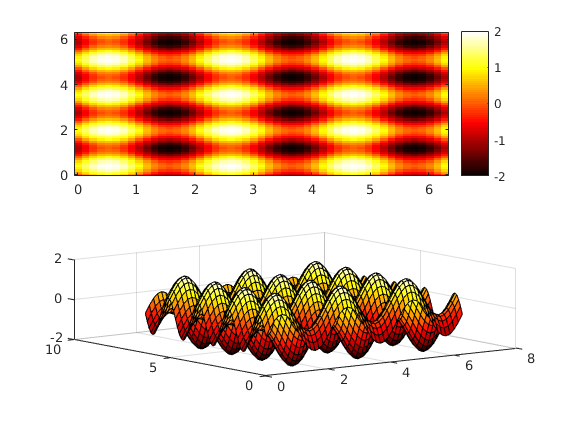
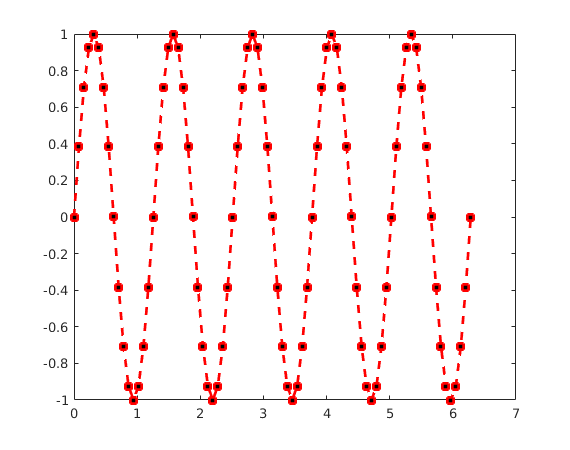
Example function plotsin2
This is an example of a function with no output argumrnts.
type plotsin2
plotsin(3,4)
function plotsin2(f1,f2)
% f1 and f2 are frequencies
x=linspace(0,2*pi,round(16*f1)+1);
figure
if nargin == 1
  plot(x,sin(f1*x),'rs--',...
  'LineWidth',2,'MarkerFaceColor','k');
elseif nargin == 2
  y=linspace(0,2*pi,round(16*f2)+1);
  [X,Y]=meshgrid(x,y);
  Z=sin(f1*X)+sin(f2*Y);
  subplot(2,1,1); imagesc(x,y,Z); colorbar;
  axis xy; colormap hot
  subplot(2,1,2); surf(X,Y,Z);
end
plotsin(5)
quiver-to add velocity vectors to a plot
This is very nice function for fieldplots to put arrows on points generated by meshgrid. To be completed by the next time.