Contents
Johdattelua interpolaatioon
L2demo1
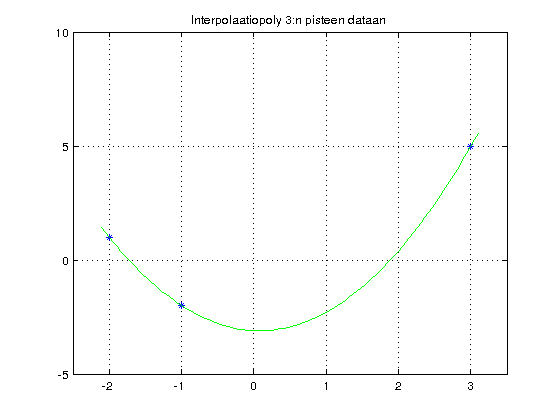
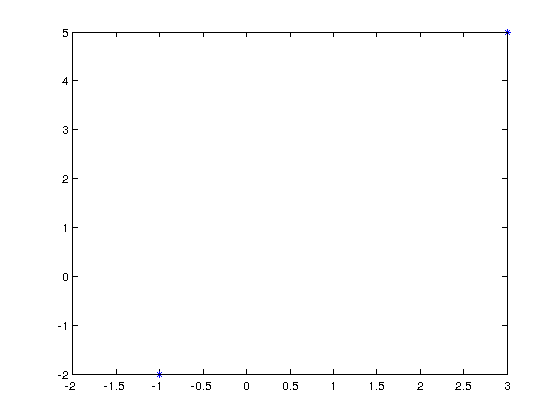
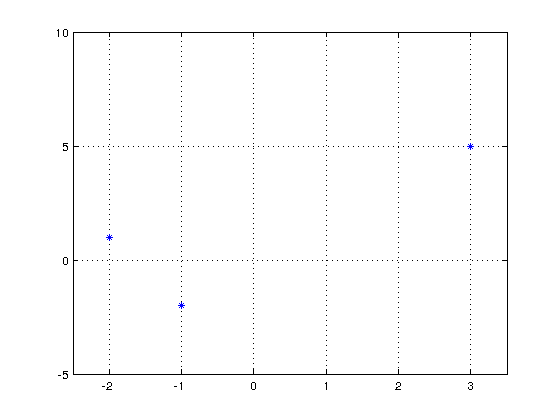
clc
close all
xdata=[-2 -1 3]
ydata=[1 -2 5];
plot(xdata,ydata,'*')
xdata =
    -2    -1     3
 A=[ones(3,1) [-2;-1;3] [-2;-1;3].^2]
 c=A\ydata'
A =
     1    -2     4
     1    -1     1
     1     3     9
c =
   -3.1000
   -0.1500
    0.9500
axis([-2.5 3.5 -5 10 ])
grid on
hold on
x=linspace(-2.1,3.1,100);
p=c(1)+c(2)*x+c(3)*x.^2;
length(p)
ans =
   100
plot(x,p)
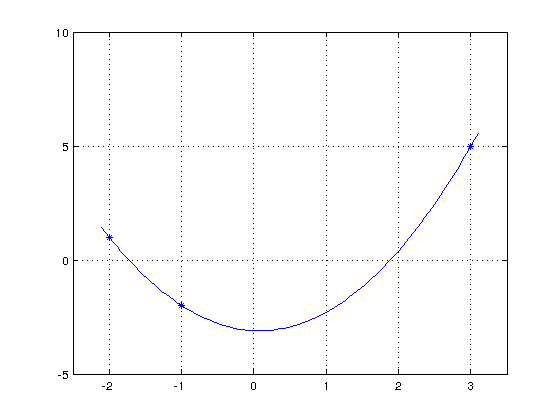
plot(x,p,'r') % Eri varilla.

Vektorien lineaarikombinaatio "riviajattelulla"
plot(x,p,'r')
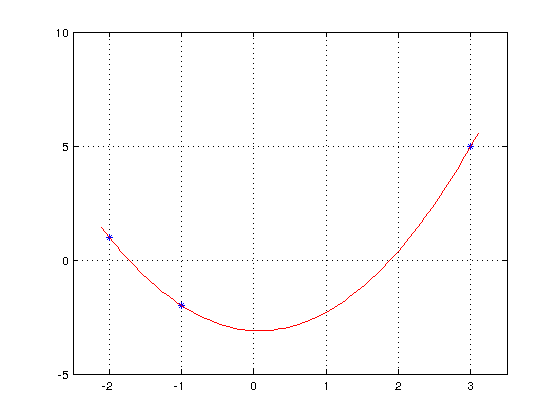
V=[ones(100,1) x' (x.^2)'];
y=V*c;
plot(x,y,'g')
title('Interpolaatiopoly 3:n pisteen dataan')