Contents
H3teht4
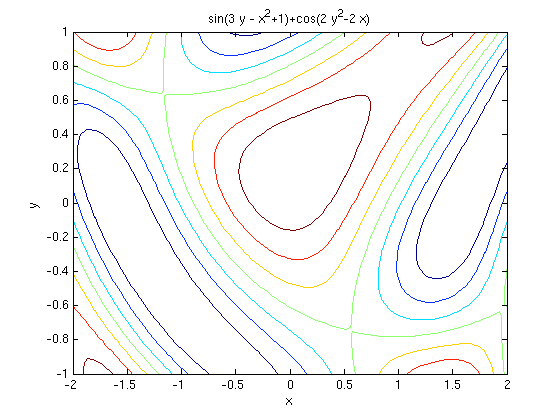
1) ezcontour
close all
ezcontour('sin(3*y - x^2+1)+cos(2*y^2-2*x)',[-2 2 -1 1])

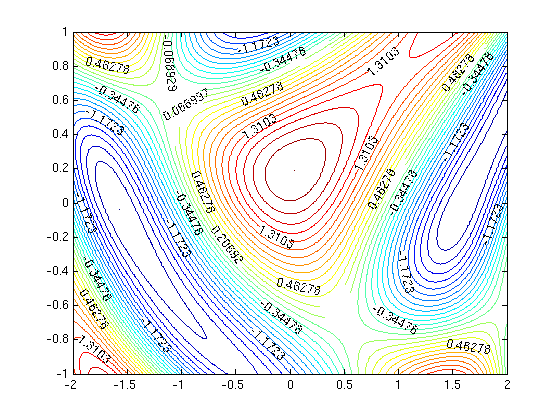
2) contour % Lisää joustavuutta ja mahdollisuuksia.
figure
x=-2:.01:2; y=-1:.01:1;
[X,Y]=meshgrid(x,y);
Z=sin(3*Y - X.^2+1)+cos(2*Y.^2-2*X);
contour(x,y,Z,20)
Z_vali=[min(min(Z)) max(Z(:))]
korkeudet=linspace(Z_vali(1),Z_vali(2),30);
contour(x,y,Z,korkeudet)
[C,h]=contour(x,y,Z,korkeudet);
clabel(C,h,korkeudet(1:6:30))
clabel(C,h,'manual')
Z_vali =

   -1.9999    2.0000


    Please wait a moment...

   Carefully select contours for labeling.
   When done, press RETURN while the Graph window is the active window.


