esim/pchippi.m
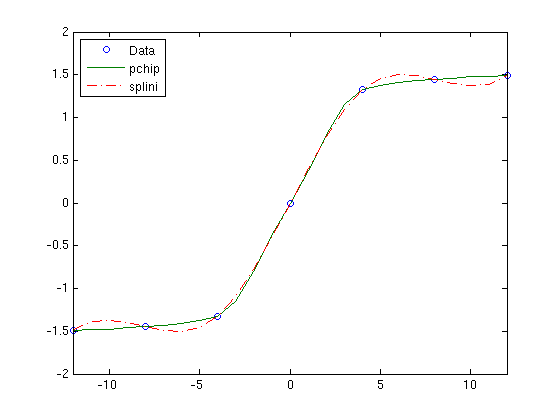
clear; close all
x=-12:4:12;
y=atan(x);
t=-12:12;   % Laskentapisteet
p=pchip(x,y,t);
s=spline(x,y,t);
plot(x,y,'o',t,p,'-',t,s,'-.','LineWidth',1.25)
xlim([-12 12]);
legend('Data','pchip','splini','Location','NW')
clear; close all x=-12:4:12; y=atan(x); t=-12:12; % Laskentapisteet p=pchip(x,y,t); s=spline(x,y,t); plot(x,y,'o',t,p,'-',t,s,'-.','LineWidth',1.25) xlim([-12 12]); legend('Data','pchip','splini','Location','NW')