17.3.1999
Mikko Kokkonen, 33015p
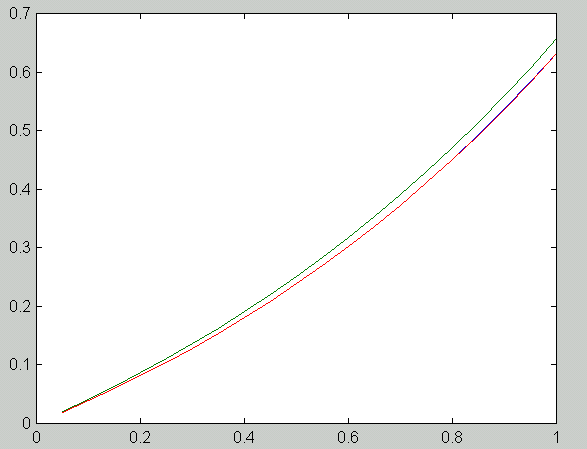
The image below shows the solutions of the boundary value problem. The blue curve is the true solution, the green curve is the numerical solution obtained with scheme 1 and the red curve is the solution obtained with scheme 2. Here n = 19.
Estimation of the rate of convergence (using the technique of Project 1.1 that has been implemented in a Matlab-script):
       n	 h	 E_h1	   E_h2	      R_1	R_2
    4.0000    0.2000	0.0946    0.0054
    9.0000    0.1000    0.0486    0.0014    0.9592    1.9987
   19.0000    0.0500    0.0247    0.0003    0.9800    1.9997
   49.0000    0.0200    0.0099    0.0001    0.9910    1.9999
   99.0000    0.0100    0.0050    0.0000    0.9961    2.0000
The scheme 2 converges faster because the two-sided finite difference
approximation of the first derivative is more accurate than the one-sided
(backward) approximation used in the scheme 1.
               True      Error
       h      error    estimate
    0.1000    0.0527    1.0417
    0.0500    0.0137    0.2604
    0.0250    0.0035    0.0651
    0.0125    0.0009    0.0163
    0.0062    0.0002    0.0041
The lesson of this exercise is that if the f'' has a large maximum value
compared to the average value of the function, then Theorem 2.2 can largely
overestimate the actual error.
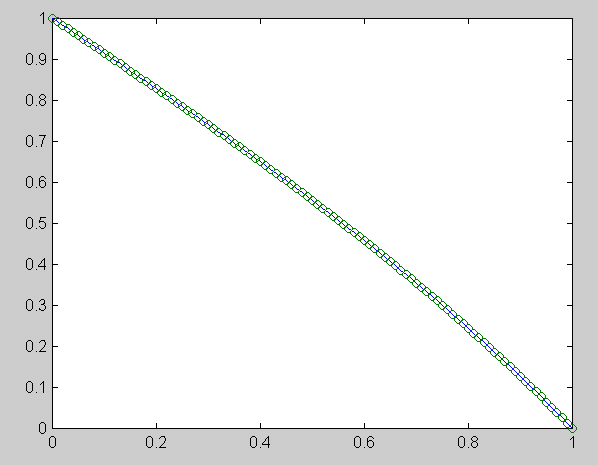
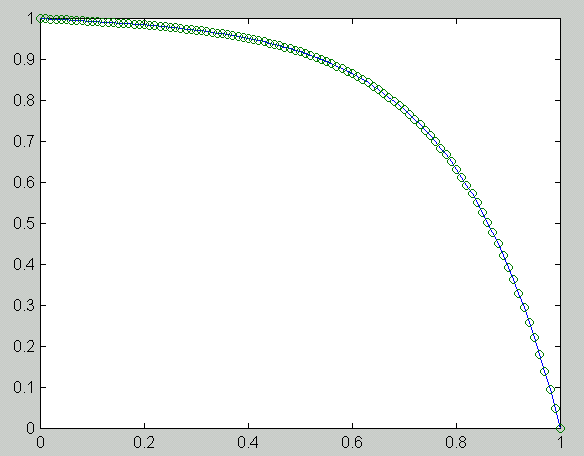
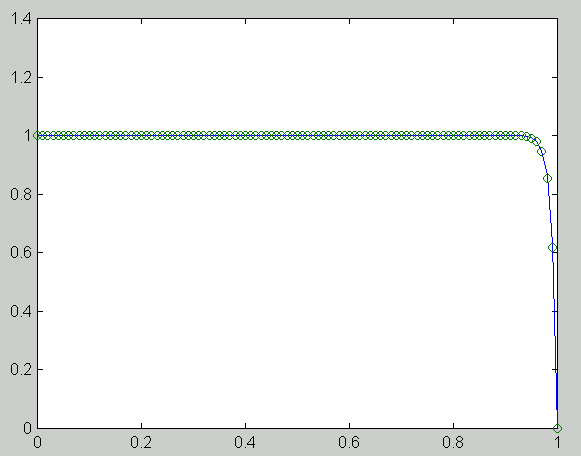
   n        h       e_1       e_5      e_100       R_1       R_5     R_100
    4    0.2000    0.0002    0.0140    0.0025
    9    0.1000    0.0000    0.0037    0.0098    1.9946    1.9100   -1.9721
   19    0.0500    0.0000    0.0010    0.0304    1.9986    1.9758   -1.6368
   49    0.0200    0.0000    0.0002    0.0362    1.9997    1.9948   -0.1935
   99    0.0100    0.0000    0.0000    0.0141    1.9993    1.9990    1.3632
  199    0.0050    0.0000    0.0000    0.0037    2.0000    1.9998    1.9105
  399    0.0025    0.0000    0.0000    0.0010    1.9999    1.9999    1.9759